.png)


 英文
英文

I. International Economy and Trade
Divergent Growth: Global Economy Slows with Regional Disparities
In 2025, due to the combined effects of rising trade barriers, increased policy uncertainty, and weak external demand, global economic growth lacked momentum. The recovery was slow and characterized by regional divergence.
Performance of Major Economies:
The U.S. economy remained trapped in structural difficulties. Manufacturing continued to weaken, with a full-year average PMI of 48.9%. Although this was 0.7 percentage points higher than in 2024, indicating a slight improvement in short-term momentum, the index remained in contraction territory, and the overall downward trend did not change. Amid the transmission of tariff pressures, inflation control was better than expected. The average year-on-year CPI for the full year was 2.7%, down 0.3 percentage points from the previous year, providing room for the Federal Reserve to cut interest rates and maintain fiscal support. While fiscal policy remained expansionary, high deficits and debt have become long-term structural risks for the U.S. economy, which may constrain future policy space and growth potential.
The Eurozone showed a weak recovery. Manufacturing recovered relatively well, with a full-year average PMI of 49%, a significant rebound of 3.1 percentage points from 2024, outperforming the U.S. in recovery strength. However, due to volatile external demand and uneven internal growth, the foundation of the manufacturing recovery was not yet solid, with noticeable fluctuations in the fourth quarter. Inflationary pressures eased significantly, and the European Central Bank cut interest rates by a cumulative 100 basis points over the year, with monetary policy now entering an observation phase.
China's economy maintained steady and high-quality operation. Despite the impact of Sino-U.S. tariff policies, which caused a temporary drop in the manufacturing PMI in April, the overall annual average remained stable at 49.6%, down only 0.2 percentage points from 2024. On the price front, low inflation persisted, with signs of a rebound toward the end of the year. The price index rose to 0.7% in November, the highest level since 2024. Monetary policy remained prudent and accommodative, with coordinated macro policies aimed at steering the economy away from inefficient competition.
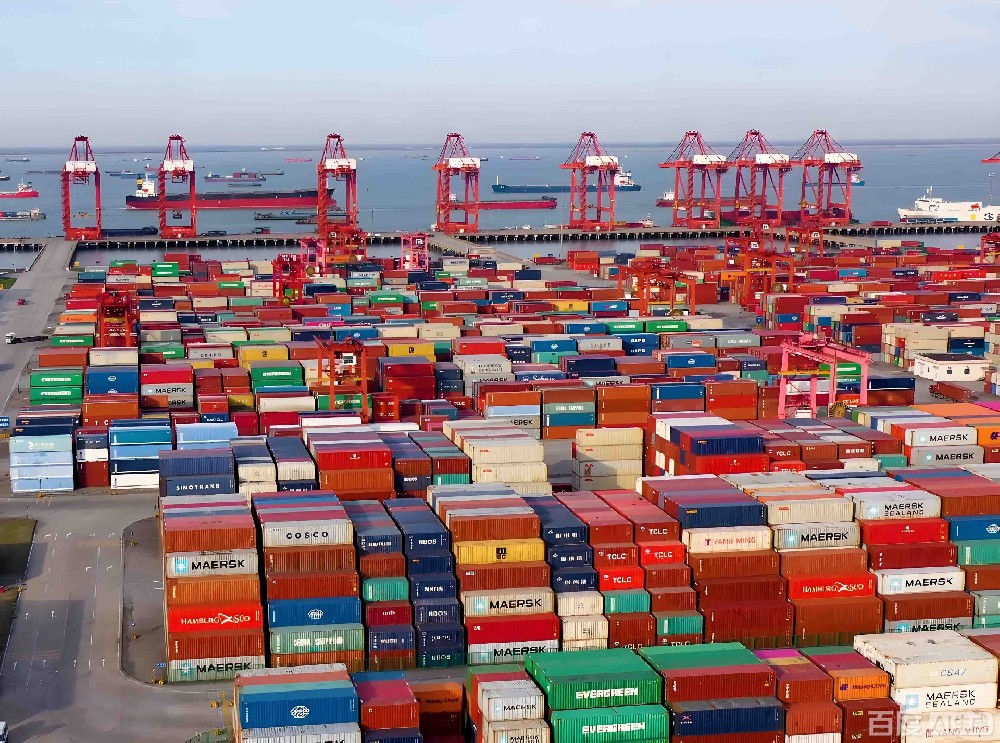
Shift in Trade Flows: China's Export Center of Gravity Moves East
In 2025, China's total goods trade reached USD 6,354.77 billion, up 3.2% year-on-year, growing faster than other major global economies. Exports reached USD 3,771.87 billion, up 5.5%; imports reached USD 2,582.9 billion, flat year-on-year. The export structure continued to improve. Looking at trading partners, the impact of U.S. tariff increases gradually became apparent. China's imports and exports to the U.S. fell more deeply, with a full-year decline of 18.7% (compared to a 10.4% decline in the first half of the year), of which exports fell 20% and imports fell 14.6%. Trade with the U.S. accounted for only 8.8% of China's total imports and exports, significantly reducing trade dependence. The ASEAN, EU, and Africa all achieved good growth, with total trade increasing by 7.4%, 5.4%, and 17.7% respectively, driven mainly by exports, which grew by 13.4%, 8.4%, and 25.8% respectively.
New and Better Export Structure: Strong Support from Mechanical & Electrical and High-Tech Products
Looking at the composition of export goods, mechanical and electrical products, as the mainstay of foreign trade, reached USD 2,301.84 billion, up 8.4% year-on-year, contributing the main growth momentum. High-tech products maintained relatively high growth, reaching USD 947.9 billion, up 7.5%. Exports of labor-intensive products reached USD 568.33 billion, down 4.7% year-on-year, with categories such as footwear, toys, and luggage falling by more than 10%, indicating that traditional advantageous products are facing external demand pressure. Notably, the "new three items" – new energy vehicles, lithium batteries, and solar cells – grew by more than 20% year-on-year, reflecting steadily increasing competitiveness in high-end manufacturing exports.
II. Port and Shipping Market
Maritime Trade: Moderate Growth, Asian Ports Perform Well
Global container shipping trade growth slowed. Clarksons forecast that global container shipping trade volume would grow by approximately 2% year-on-year in 2025, significantly slower than in 2024.
By region, major European and American ports experienced weak throughput growth due to sluggish demand, policy uncertainty, and local strikes. Asian ports, on the other hand, were more active due to industrial relocation and demand substitution effects. In the first 11 months, throughput at the Port of Singapore, Thailand's Laem Chabang Port, and India's Jawaharlal Nehru Port grew by 8.5%, 9.2%, and 15% year-on-year, respectively. Domestic Chinese ports maintained steady growth. In 2025, the Port of Shanghai's container throughput exceeded 55.06 million TEU, up 6.9% year-on-year, ranking first among global ports for the 16th consecutive year. Ningbo Zhoushan Port's container throughput exceeded 43 million TEU, firmly ranking third globally, while its cargo throughput exceeded 1.4 billion tons, ranking first globally for the 17th consecutive year.
Vessel Capacity: High Growth, Market Supply Largely Saturated
According to statistics, the global container ship fleet capacity exceeded 33 million TEU, up 7.2% year-on-year, with the year-end idle fleet ratio approaching 1%. Against the backdrop of Red Sea diversions, the market had an overcapacity of approximately 1.5 million TEU, accounting for 4.5%. By route, the Far East – North America route was the only region where capacity was reduced due to weak demand, with some large vessels transferred to the Far East – Europe route. Emerging markets such as the Middle East and Africa became key areas for capacity growth, with a significant increase in very large vessels.
Notably, navigational safety in the Suez Canal improved. Maersk's vessel "Maersk Sebarok" became the first Maersk vessel to transit the Suez Canal since early 2024, on 19 December 2025. The vessel operates on the India-U.S. East Coast MECL service. However, Maersk emphasized at the time that this did not mean an immediate full return of its east-west trunk network to the Suez Canal, but rather a phased, gradual approach. The Suez Canal Authority had previously claimed that Maersk would fully resume transits in early December, a claim Maersk later clarified. The trial transit was the first step in the return.
Container Freight Rates: Significant Correction but Still Above Average
In 2025, the overall freight rate trend showed a pattern of "sharp volatility and mean reversion". The average composite index fell significantly year-on-year but remained notably higher than 2023 levels. Looking at the specific trend: at the beginning of the year, the market entered a traditional low season, and rates fell from their highs. In the second quarter, driven by the tariff window period, market demand saw a staged rebound. Coupled with tight spot capacity, rates jumped at the end of May but failed to generate sustained upward momentum. With the injection of new capacity and fading market sentiment, rates gradually fell back in the third quarter, converging toward 2023 levels, and the traditional peak season was weak. In November, demand picked up, and with the approach of the annual contract signing season, liner companies generally announced rate increases, leading to a modest upward oscillation.
By route, due to divergent international trade performance, the export route structure was adjusted. The following is an analysis of key route freight rates.
Europe Route
Although demand maintained a growth trend, excessive new capacity weighed on rates from their highs. In late April, due to the inflow of capacity from the U.S. route, rates fell to USD 1,800/FEU. In mid-May, rates rebounded quickly due to the return of capacity from the U.S. route, strikes, and congestion, reaching USD 3,500/FEU in late July, ending the peak season early. After the October holiday, rates continued to rise, driven by demand for exports of products such as photovoltaics and the traditional pre-Chinese New Year peak season, but the year-end rebound was limited. By the end of December, the SCFI spot booking rate for the Europe route fell back to the range of approximately USD 1,533–1,690/TEU. Over the full year, the per-TEU rate on the Europe route fell by approximately 42.94%.
North America Route
Freight rates were significantly volatile due to the impact of U.S. tariffs. In the first quarter, due to early shipments in the previous year and the low season, rates on the East and West Coast routes fell sharply, to less than half and one-third of their levels at the beginning of the year, respectively. At the end of May, rates jumped to their year-highs due to tariff adjustments, reaching USD 7,000/FEU for the East Coast and USD 6,000/FEU for the West Coast. Thereafter, as cargo volumes lagged behind capacity, rates fell back from their highs and adjusted in a volatile manner. In mid-December, spot rates on the West Coast route rose back to approximately USD 1,992/FEU, while East Coast rates rose to approximately USD 2,846/FEU. Over the full year, the per-FEU rate on the West Coast route fell by approximately 52.24%, and on the East Coast route by approximately 50.07%.
Middle East Route
Cargo demand was strong throughout the year, but capacity levels suppressed rates. In the first quarter, affected by Ramadan, rates fell first and then rose, reaching USD 1,800/FEU in a single week at the end of March. In June, rates were pushed up to a high of USD 2,900/FEU by the diversion of capacity from the U.S. route, before falling back as capacity increased. After October, demand again drove rates up, reaching USD 2,600/FEU at the end of the year.
Southeast Asia Route
U.S. tariffs drove strong overall demand for exports to Southeast Asia, but capacity supply remained the main influencing factor. In April, affected by the escalation of U.S. "reciprocal tariff" policies, export demand to Southeast Asia increased, and rates on the Thailand-Vietnam and Singapore-Malaysia routes rose modestly to USD 1,040/FEU and USD 850/FEU, respectively. After the National Day holiday, processing and production demand for some transshipped goods led to tight space in the market, and rates on the Thailand-Vietnam and Singapore-Malaysia routes briefly reached as high as USD 1,250/FEU and USD 970/FEU, respectively, at the end of November.