.png)


 英文
英文

Peak season may have already ended, yet freight rates refuse to fall — the transpacific trade lane in August 2026 is staging a rare "supply-demand divergence." On August 7, the SCFI climbed for the second consecutive week, with both US West Coast and US East Coast rates rising in tandem, even as US import volumes trended downward month over month. Behind this counterintuitive surge lies the convergence of four forces: carrier capacity discipline, Panama Canal draft restrictions, typhoon disruptions, and tariff uncertainty.
I. Three Indices in Sync: US Rates Climb for Second Consecutive Week
On August 7, the Shanghai Containerized Freight Index (SCFI) stood at 3,276.14 points, up 2.18% week over week — its second straight weekly increase. The Far East to US West Coast route rose by 255 to 6,484/FEU, a weekly gain of 4.09%; the Far East to US East Coast route climbed 236 to 9,290/FEU, up 2.6%.
This was not an isolated signal from a single index. Xeneta data from August 6 showed the Far East to US West Coast market average rate at 6,824/FEU, up 13.8% week over week; the Far East to US East Coast rate approached the 10,000 threshold at 9,988/FEU, up 12.8%. On the same day, the Drewry World Container Index (WCI) rose 1% to 4,297/FEU, with Shanghai to Los Angeles up 3% to 5,894/FEU and Shanghai to New York up 4% to 7,893/FEU.
Three independent indices all pointed in the same direction: US-bound freight rates were accelerating upward. Even more noteworthy was the spread between the East and West Coasts — the 2,806 gap between 6,484 and 9,290 far exceeded the normal differential of approximately 1,000, signaling that East Coast services were facing supply pressures far exceeding those on the West Coast.
Meanwhile, European and Mediterranean routes continued to decline: the Europe route fell 2.46% to 2,964/TEU, and the Mediterranean route dropped 3.36% to 4,048/TEU. The "US strong, Europe weak" divergence had become the most defining feature of the global shipping market in August 2026.
II. 15th GRI of the Year: Six Carriers Raise Rates in Concert
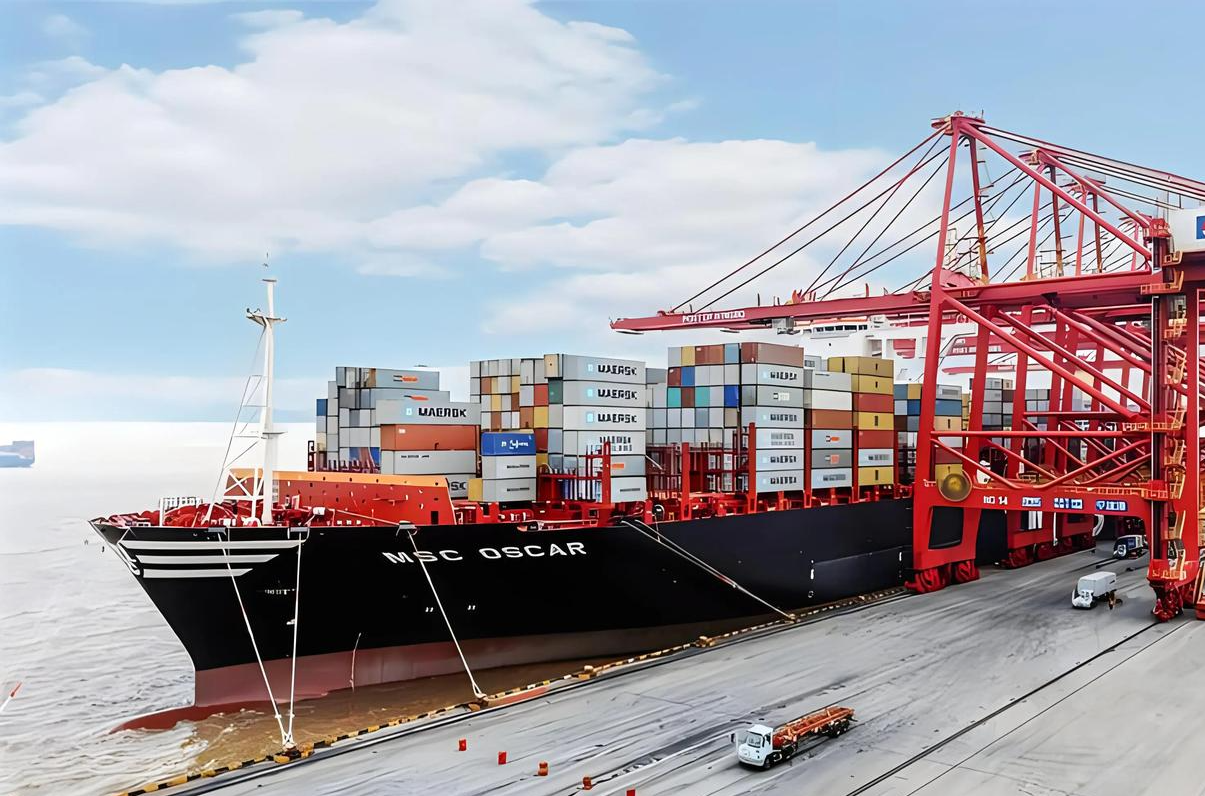
Entering August, six major carriers — CMA CGM, COSCO Shipping, Evergreen, HMM, Yang Ming, and ZIM — successively implemented a new round of General Rate Increases (GRI), ranging from 1,500 to 3,000 per FEU. Evergreen and HMM were the most aggressive, targeting 3,000/FEU; CMA CGM, Yang Ming, and ZIM followed at 2,000/FEU; COSCO Shipping raised rates by $1,500/FEU. This marked the 15th GRI adjustment on US trade lanes in 2026.
Driven by these increases, US West Coast market quotations surged to the 6,500–9,000/FEU range, while some US East Coast quotes breached the 10,000/FEU mark, with certain direct-contract rates reaching 10,500. According to Navia Freight's August market report, the August 1 GRI was "sticking," with carriers actively managing capacity through blank sailings, route optimization, and slot control. Blank sailing plans covered both East and West Coast services every week from late July through mid-August. Cancellation rates on certain US East Coast services reached as high as 40% to 57%.
More alarmingly, the market anticipated another round of US East Coast/Gulf Coast GRI effective August 15. With berth space already extremely tight, the probability of a successful additional increase was high.
III. Panama Canal "Water Shortage": The Most Direct Supply Shock to East Coast Services
If the GRI represented carriers' proactive pricing behavior, the Panama Canal draft restriction was an unavoidable hard constraint on East Coast services.
The Panama Canal Authority had successively lowered the maximum draft for Neopanamax locks from 49.5 feet: to 49.0 feet effective July 24, with a further reduction to 48.5 feet scheduled for August 15. Every 15-centimeter reduction in draft meant large container ships had to carry hundreds fewer standard boxes, directly pushing up per-unit transportation costs. Meanwhile, the "Phase 3" daily booking auction for the Panamax locks was suspended, reducing daily bookable vessels from 36 to 34. The average waiting time for unbooked southbound vessels had climbed to 10.6 days.
According to NOAA forecasts, the El Niño phenomenon would continue to intensify through the second half of 2026, with an 81% probability of a strong El Niño event from October to December. This meant the canal's transit restrictions were not a short-term issue but an evolving medium-term problem. Panama Maritime Consulting Group estimated that the latest adjustments had reduced per-vessel usable capacity by approximately 2,000 TEU.
Carriers moved quickly to pass costs through. CMA CGM imposed a 320/TEU surcharge on Far East cargo via the canal to the US East Coast and Gulf Coast effective July 25; Hapag-Lloyd announced 130/TEU effective August 15; MSC announced $100/TEU effective August 19. Combined with previously implemented Peak Season Surcharges, total per-container logistics costs on the China-US trade lane had risen more than 15% year over year.
IV. Typhoon Dolphin Pours Oil on the Fire: Ningbo-Zhoushan Port Full Shutdown
Just as rates remained elevated, Typhoon Dolphin — the 13th named storm of the season — was creating new supply chain disruptions along the East China coast.
At 5:00 PM on August 7, all container ships at Ningbo-Zhoushan Port completed departure from berths. Of the port's 145 terminal operators, 98 had ceased operations. All container terminal loading and unloading was fully suspended, and 22 passenger and ferry routes were entirely halted. This was not a partial restriction — it was a full port shutdown. Beginning August 8, Shanghai's Yangshan and Waigaoqiao terminals also progressively suspended empty and laden container gate-in and pickup operations. Meteorological authorities predicted the typhoon would make landfall between Zhejiang and northern Fujian from the afternoon of August 9 through the morning of August 10, with port weather risks not gradually subsiding until August 12.
This meant the entire Yangtze River Delta's export shipping window was simultaneously closed. The previous round of typhoons (Bavi + Noul) had directly driven a 12.54% weekly surge in US West Coast rates and a 12.61% surge in US East Coast rates. Typhoon Dolphin's coverage and port shutdown scale were of the same magnitude, meaning berth congestion, port-call skips, and cargo rollover risks could all erupt simultaneously.
Notably, maritime authorities had coordinated 42 large container ships of 250 meters or above to seize the pre-typhoon window for emergency berthing and unloading. Even so, full recovery would require digesting a massive backlog of vessels and cargo, potentially taking weeks.
V. Peak Season "Already Over" but Rates Don't Fall: Capacity Control Is the Core Variable
The most intriguing aspect was that the rate increase was not driven by demand growth. The Global Port Tracker released on August 9 by the National Retail Federation (NRF) and Hackett Associates showed that US major port import volumes likely peaked in May at 2.24 million TEU, then declined month over month: 2.23 million in June, 2.21 million in July, and a projected 2.22 million in August (down 4.2% year over year), with September projected to fall further to 2.16 million TEU. From May to November, monthly import volumes were expected to decrease by approximately 9%. The report stated plainly: "This year's container import peak season for the US may have already ended prematurely."
Volumes were cooling, yet rates rose instead of falling — the core reason lay in carriers' capacity management capabilities. Through sustained blank sailings, route adjustments, and slot management, liner companies were maintaining effective capacity in a tight balance. Effective capacity on the Asia-to-US West Coast route in August was projected to decrease approximately 3% compared to July. At the same time, US Section 301 tariffs took effect on July 24, covering roughly 60 trading partners, but the tariff levels (10% to 12.5%) were not significantly higher than the expiring Section 122 rates, effectively extending some importers' front-loading window. The USTR's investigation into excess manufacturing capacity by 16 of the largest US trading partners was nearing completion, and expectations of a new round of tariff uncertainty continued to support advance stockpiling demand.
Furthermore, the Strait of Hormuz situation remained tense. PortWatch data showed only 10 transits on July 30, compared to a pre-crisis daily average of 88. Houthi forces declared a blockade of Saudi ports from July 20, and Bab el-Mandeb transit volumes had fallen by roughly half compared to the Q2 average. Both major Middle East chokepoints were under simultaneous pressure. Cape of Good Hope routing remained the standard for major carriers, with global effective capacity continuously consumed by the additional voyage distance.
VI. Conclusion: Building Resilience Matters More Than Predicting Rates
The trajectory of US-bound freight rates in August 2026 was fundamentally the result of four converging forces: carriers' proactive capacity management, the Panama Canal's hard constraints, seasonal typhoon disruptions, and tariff uncertainty. When the demand side had already begun to cool, the "invisible hand" on the supply side continued to tighten — this was the underlying logic behind the current divergence between rates and cargo volumes.
For exporters and freight forwarders, the most pragmatic strategy was not to bet on when rates might fall, but to: first, closely monitor weekly SCFI data and carrier blank sailing announcements, and lock in space and pricing before GRI effective dates; second, evaluate the cost-effectiveness of US West Coast versus East Coast routes, flexibly switching when the East-West spread widens abnormally; third, allow ample transit buffer time for typhoon season and canal draft restrictions to avoid additional costs from post-arrival congestion. In an era where uncertainty has become the norm, the core of supply chain resilience is not predicting freight rates, but building the elasticity to respond to volatility.
Disclaimer: Data in this article is sourced from public channels for industry analysis purposes only and does not constitute any decision-making advice. Actual freight rates are subject to official carrier quotations.