.png)


 英文
英文

The first half of 2026 delivered a market performance that exceeded everyone's expectations. The US-Iran conflict triggered a phased blockade of the Strait of Hormuz; tariff hike expectations sparked front-loading peak season shipments; and the normalized rerouting around the Cape of Good Hope passively contracted effective capacity. With multiple factors converging, freight rates on major European and American trade lanes hit their highest levels since 2025. The Ningbo Containerized Freight Index (NCFI) averaged 16% higher year-on-year in H1, with the composite index soaring 88.3% from the beginning of the year by end-June.
But by August, cracks were appearing. The latest SCFI released on August 14 stood at 3,355.24 points, rising for the third consecutive week (+2.41%). However, beneath the surface: USWC at 6,714/FEU (+3.55%), USEC at 9,568/FEU (+2.99%), and Persian Gulf at 5,422/TEU (+3.1%) all surged; while Europe at 2,945/TEU (-0.64%) and Mediterranean at $3,929/TEU (-2.93%) continued to drift lower. A single index masked three distinct markets — the "US hot, Europe cool, Middle East scorching" three-track divergence has fully crystallized.
So how will the shipping market perform in H2 2026? The answer lies in three threads: supply-demand fundamentals, geopolitical variables, and structural divergence.
I. Supply Side: The Newbuilding Delivery Flood Is Coming
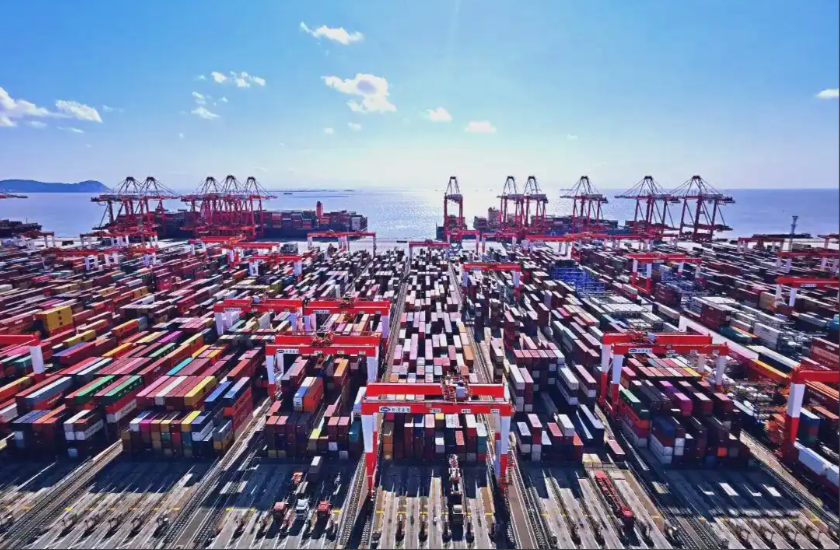
Global container fleet capacity has exceeded 34 million TEU, growing more than 5.5% year-on-year. Clarksons data shows that total newbuilding deliveries in 2026 will reach approximately 1.477 million TEU, with over 60% concentrated in June through December — making H2 the absolute peak delivery window. Alphaliner and Clarksons forecast full-year fleet growth of 6.5% to 7.2%, far outpacing global container trade volume growth of 2.5% to 3.5%. Veson Nautical further notes that container fleet capacity will grow at an average annual rate of 10.2% from 2026 to 2029, with supply pressure continuing to accumulate.
A high-frequency indicator worth watching is the idle rate of mega-vessels. As of August 12, the idle rate for 17,000+ TEU ultra-large containerships was merely 1.3%, corresponding to just 3 vessels and approximately 68,230 TEU — and on several previous trading days, it was even lower at 0.9%. This is not a demand surge; rather, it reflects how Cape of Good Hope rerouting extends Asia-Europe one-way voyages by 10 to 14 days, equivalently contracting capacity by 10% to 15%, forcing owners to drain the idle pool to maintain schedules. Once rerouting eases or demand weakens, a rising idle rate will serve as a leading indicator of freight rate declines.
The order book is even more alarming. As of July, the full containership order book represented approximately 40% of the existing fleet, with the 17,000+ TEU segment at over 90% — meaning massive new vessels will continue hitting the water over the next two to three years. The divergence between nominal and effective capacity is the market's greatest structural contradiction for H2.
II. Demand Side: Front-Loading Exhausted, Demand Vacuum Arrives
The essence of H1's rally was a phased market movement driven by "geopolitical rerouting + tariff-driven front-loading + cost push," not sustainable growth from global trade recovery. This judgment is confirmed by data from multiple institutions.
The WTO projects global merchandise trade volume growth to slow from 4.6% in 2025 to 1.9% in 2026. The World Bank downgraded its global economic growth forecast to 2.5% in June, the lowest since the pandemic. The National Retail Federation's (NRF) Global Port Tracker projects US imports at 2.12 million TEU in August (-8.6% YoY) and 2.06 million TEU in September (-2.2% YoY), suggesting the peak season may have already ended prematurely.
Europe is equally concerning. Nanhua Futures' container shipping weekly report notes that the European lane exhibits clear "weak peak season" characteristics — after Red Sea rerouting became normalized, European importers front-loaded replenishment, with concentrated shipments in June-July prematurely exhausting August demand. The SCFIS Europe settlement freight index latest stood at 3,383.88 points, down 3.9% week-on-week, having fallen over 12% from its mid-July peak of 3,854.82 points. Drewry's Shanghai-Rotterdam spot rate latest reported 4,653/FEU, down approximately 220 from the mid-July peak of $4,873.
From carriers' quoting behavior, the willingness to cut prices to capture cargo is already very clear. This week's Shanghai-Rotterdam 40GP spot quotes: Gemini at 4,872, Premier at 4,601, Ocean at 5,572, MSC at 5,482; the following week's quotes dropped further to 4,677, 4,579, 5,501, and 4,748, with MSC slashing over $700 in a single week.
III. Red Sea Resumption: The Sword of Damocles Over the Market
The Red Sea resumption process is the single most critical variable determining H2's trajectory, bar none.
Since August, resumption signals have clearly intensified. Maersk's AE19 service officially underwent a structural switch back to the Red Sea-Suez route; the AE15 service resumed Suez transit in July and added a Jeddah call; the MECL and WAF6 services have gradually returned. The 20,000+ TEU giant "Manchester Maersk" executing the AE2/NE1 Asia-Northern Europe mainline voyage transited the Suez Canal westbound on August 15-16, marking a milestone signal of post-crisis resumption on the Northern Europe lane. Suez Canal revenue for fiscal year 2025/26 reached $4.67 billion (+23%), with transits up 10% and tonnage up 22%. Linerlytica data shows that the share of capacity rerouting around the Cape of Good Hope has dropped to 5.2%, the lowest since January 2024.
But risks are far from eliminated. On August 15, a bulk carrier was struck by an unidentified flying object in the Strait of Hormuz, once again exposing the fragility of "limited recovery." Iran's Revolutionary Guards reaffirmed that Hormuz "remains in a closed state," with current daily transits at only 8-13 vessels versus a pre-crisis norm of 130-140. Houthi threats against Saudi-linked vessels persist, with war risk insurance premiums still at 0.75% of hull value.
The market is already pricing in resumption expectations. EC2610 futures fell 4.12% on August 11 to 1,569 points, with September contracts at a 35% discount and far-month contracts under sustained pressure. The Shanghai International Shipping Institute predicts SCFI will trade in the 2,800-3,100 range in August, easing to 2,400-2,800 in September-October; if the Red Sea fully resumes, the index could drop further to 2,000-2,200.
IV. Structural Divergence: US "Hard," Europe "Soft," Middle East "Scorching"
The defining characteristic of H2 is not simply up or down, but divergence.
US lanes supported by "hard constraints." The Panama Canal draft has undergone four consecutive reductions — dropping to 14.78 meters on August 15, with a further decline to 14.63 meters expected on August 26 — forcing large containerships to carry hundreds fewer TEUs, directly pushing up unit costs. The August GRI marks the 15th rate increase of 2026, with Evergreen/HMM raising 3,000/FEU and CMA CGM/Yang Ming/ZIM raising 2,000. The USEC-USWC spread has widened beyond 2,800, with direct-customer quotes exceeding 10,500/FEU. Panama Canal daily auction slot prices averaged 1.1 million (16 times the same period last year), with a single vessel paying a record 4 million "priority fee" on August 10.
European lanes undergoing "soft landing." With new vessels concentrating deliveries in H2, weekly nominal capacity deployment on the Asia-Europe lane may increase approximately 6%. Maersk's WEEK33 quote dropped to 4,600 (-6.5%), ONE fell to 4,608, and MSC announced a hike to 7,800 but actually dropped to 4,840 — the "announced hike vs. actual decline" pricing game has become the norm. PSS was reduced from 500/1,000 to 250/500.
Middle East lanes sustained by "geopolitical premium." The Persian Gulf route reached 5,422/TEU (+3.1%), with direct service recovery "nowhere in sight." Four layers of surcharges stack up (war risk + emergency conflict + emergency fuel + peak season), bringing all-in quotes from Shenzhen to Jebel Ali to 8,250-$9,500/40HQ, up 35%-55% from July.
V. Key Risk Variables
The greatest uncertainties for H2 come from two directions.
Tariff policy. The 10% global temporary import surcharge imposed under Section 122 of the Trade Act of 1974 expired on July 24. However, the USTR issued a notice in June investigating 60 economies for failing to effectively enforce prohibitions on forced labor products, proposing additional tariffs of 10% to 12.5% on China mainland and Hong Kong, China. With midterm elections approaching in November, tough-on-China posturing has become bipartisan consensus, and further tariff escalation before the elections cannot be ruled out. This means the "tariff window front-loading" pattern may recur repeatedly, disrupting traditional seasonal cycles and significantly amplifying freight rate volatility.
Geopolitical situation. The pace of Hormuz Strait transit restoration remains unclear. BIMCO's chief shipping analyst notes that even if the strait reopens, significant market uncertainty will persist. If the strait is blocked again, fuel and insurance costs will spike anew; if transit continues to ease, geopolitical risk premiums will accelerate their retreat. On the Red Sea front, the Gemini alliance's gradual resumption strategy has evolved from "testing" to "institutionalization," but Houthi threats have not been fully eliminated.
Conclusion
Overall, the probability of container shipping rates coming under downward pressure in H2 2026 is high. In the short term, the demand vacuum following front-loading exhaustion and declining oil prices jointly constitute downward pressure. In the medium to long term, concentrated new vessel deliveries in 2027-2029 will intensify supply-side pressure, but the Red Sea resumption process remains the decisive variable — once full transit resumes, the large-scale return of rerouted capacity will one-time release 8% to 10% of effective capacity, potentially driving spot rates down more than 30%.
However, the freight rate center will not return to pre-pandemic levels. Global port congestion has normalized to pandemic-era levels, with Northeast Asia accounting for 40% of congested capacity; declining container turnover efficiency means actual available box volumes fall far short of nominal figures; and accelerated scrapping of aging fleets can offset some new supply. As CITIC Construction Investment notes: H2 rates are expected to peak and decline, but the medium-term center may remain relatively elevated.
For shippers, the riskiest strategy is waiting for the "absolute bottom." A smarter approach is to build a dynamic booking model that maintains flexible allocation between spot and long-term contracts, leverage digital tools for real-time tracking of in-transit cargo and port congestion, and incorporate freight rate volatility into routine supply chain management. In an era where uncertainty is the norm, the value of resilience far exceeds that of prediction.
Disclaimer: Data in this article is sourced from public channels for industry analysis reference only and does not constitute any decision-making advice. Actual freight rates are subject to carriers' official quotations.